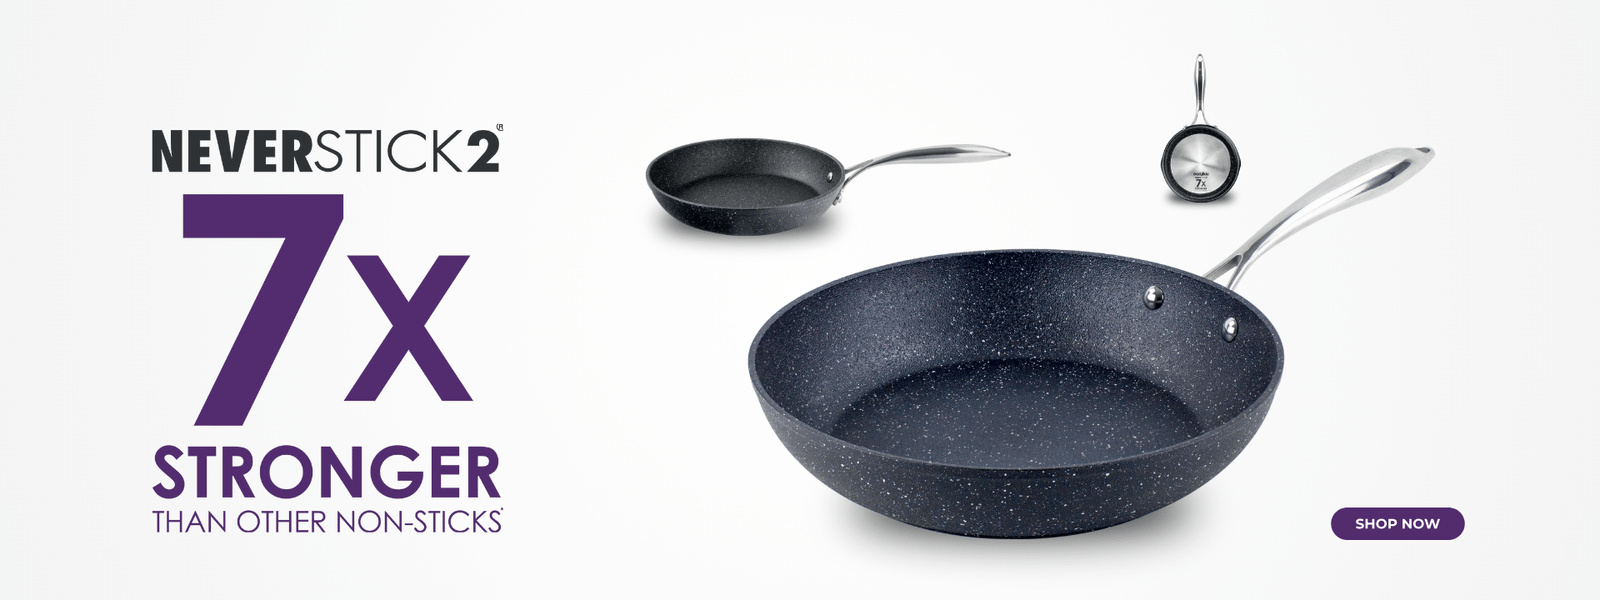
*what do we mean by 7 times stronger?
in January 2019 we commissioned an independent laboratory to run a series of tests to compare our pans to those of other manufacturers and see how much stronger we really are than some of the new ranges now in the market. below you’ll find a detailed explanation of what we mean by ‘6 times stronger than other non-sticks’, an explanation of how we selected the sample and the methodology of the testing.


the sample
to select an appropriate sample, we began by identifying the main players in the cookware market. based on a market insight report conducted in 2017 by one of the world’s largest market research organisations, the largest brands specific to the cookware market in the UK were Tefal (29.5% market share), followed by Scoville, JML, Salter and Prestige. in addition to this, there are a number of retailer own-brand ranges, like those of Tesco and Debenhams, which accounted for 50.5%.
the sample continued
it would obviously be impracticable to test every pan by every manufacturer, especially as product ranges undergo changes regularly, but we deliberately selected a wide sample for our tests in an effort to be as accurate as possible.
we selected 35 different pans in total, (including some pans which are more expensive than ours) to emulate what a typical consumer would experience when buying a new pan. a full list of the pans we tested is below.
in total, we believe that our sample is representative of the current market.


scratch resistance
a scratch test is the process of measuring a surface’s reaction to a pointed stylus being dragged across it. testing in this way provides information on a material’s resistance to scratches and abrasions as well as how much force a surface can withstand before the non-stick coating is damaged. by increasing hardness as a function of distance, the point and method of failure can be determined.
procedure
the independent lab used a machine called a Teer Coatings ST200 scratch tester with a diamond tipped probe (angle 120° and radius 0.2 mm) for the test. The initial load for start of test was 1 N at a loading rate of 40 N/min and a table speed of 5 mm/min.
scratch marks were analysed by the lab using an Inspex HD 1080p Digital Microscope from point of continuous metal exposure.


the results
the ‘failure force’ (measured in Newtons) shown in figure 2 represents the force that was required during the test to cause continuous metal exposure of the pan. as such, the higher the force required to cause metal exposure, the stronger the pan is deemed to be.
in this lab test, the coating used for eaziglide Neverstick+ required at least 7 times more force to cause continuous metal exposure, meaning that it was shown to be at least 6 times as strong as the other pans we tested.
all information is factual at the time of posting, we update the sample as often as we can to give the most accurate data that we can provide.
| Ref | Brand | Range | Failure Force (N) | eaziglide Strength Ratio |
|---|---|---|---|---|
| 1 | eaziglide | Neverstick2 | 86.8 | 1.0 |
| 2 | Competitor 1 | Range 1 | 10.2 | 8.5 |
| 3 | Competitor 1 | Range 2 | 5.0 | 17.3 |
| 4 | Competitor 1 | Range 3 | 9.9 | 8.8 |
| 5 | Competitor 1 | Range 4 | 4.7 | 18.4 |
| 6 | Competitor 1 | Range 5 | 7.8 | 11.1 |
| 7 | Competitor 2 | Range 1 | 5.3 | 16.5 |
| 8 | Competitor 3 | Range 1 | 8.7 | 10.0 |
| 9 | Competitor 4 | Range 1 | 8.9 | 9.8 |
| 10 | Competitor 5 | Range 1 | 7.0 | 12.5 |
| 11 | Competitor 6 | Range 1 | 8.1 | 10.7 |
| 12 | Competitor 7 | Range 1 | 9.9 | 8.8 |
| 13 | Competitor 8 | Range 1 | 3.3 | 26.6 |
| 14 | competitor 9 | Range 1 | 6.4 | 13.6 |
| 15 | Competitor 1 | Range 6 | 7.4 | 11.8 |
| 16 | Competitor 1 | Range 7 | 7.6 | 11.5 |
| 17 | Competitor 1 | Range 8 | 10.0 | 8.7 |
| 18 | Competitor 10 | Range 1 | 3.2 | 27.4 |
| 19 | Competitor 11 | Range 1 | 3.7 | 23.2 |
| 20 | Competitor 5 | Range 2 | 8.7 | 10.0 |
| 21 | Competitor 12 | Range 1 | 8.4 | 10.4 |
| 22 | Competitor 1 | Range 9 | 7.0 | 12.4 |
| 23 | Competitor 1 | Range 10 | 8.1 | 10.7 |
| 24 | Competitor 1 | Range 11 | 6.7 | 12.9 |
| 25 | Competitor 13 | Range 1 | 10.7 | 8.1 |
| 26 | Competitor 14 | Range 1 | 5.0 | 17.3 |
| 27 | Competitor 15 | Range 1 | 9.5 | 9.1 |
| 28 | Competitor 16 | Range 1 | 8.2 | 10.6 |
| 29 | Competitor 17 | Range 1 | 3.5 | 24.9 |
| 30 | Competitor 18 | Range 1 | 3.9 | 22.3 |
| 31 | Competitor 19 | Range 1 | 4.3 | 20.3 |
| 32 | Competitor 20 | Range 1 | 0.4 | 193.5 |
| 33 | Competitor 15 | Range 2 | 2.5 | 34.7 |
| 34 | Competitor 21 | Range 1 | 7.9 | 11.0 |
| 35 | Competitor 1 | Range 12 | 5.6 | 15.6 |
| 36 | Competitor 22 | Range 1 | 9.6 | 9.0 |


